Utilities and realities of on-farm data use
Readers of this paper and professionals in the dairy sector are aware of the current situation in the milk production sector and how turbulent the 2021 year has been. Milk market prices have been more volatile for years now, but in recent months the situation has become more critical.
More and more milk producers are becoming more efficient. The trends and causes vary by area or region. One example could be that farmers trend to increase herd size in recent year in order to dilute costs over more producing animals. There is also a trend of being more progressive and adapting more technology. These producers seek to increase income by improving productivity, without necessarily increasing herd size. For example, by improving milk quality (fat and protein), or installing milking robots which give cows free access to be milked, or improving animal comfort in facilities, or adapting new technology for reproduction or feeding.
Dairy sector is a clear example of a great capacity for resilience, for adapting to changes during critical times.
The aim of this article is to highlight the appropriate use of data and information offered by decision support tools, or on-farm data management software, which are being introduced on farms, and to highlight critical areas where work can be done to improve the use and performance of these tools.
Farm modernization and data flow
Innovation in technology over the last few decades has helped significantly to boost the sector. The introduction of technologies such as robotic milking, calf feeders, modern scales and total mixed rations (TMR), improvements in genetics such as the use of sexed semen, diagnostic techniques for milk measurements or accelerometers (pedometers and collars) to detect changes in animal activity have great potential to improve herd health, welfare and reproductive performance (Rutten et al., 2013; Barkema et al., 2015).
Moreover, use of technology is more frequent on larger farms; focusing, for now, on systems that allow labor reduction (Gargiulo et al., 2018). In general, dairy farms that want to remain active are increasing their herd size and, therefore, the use of precision technologies is becoming more and more frequent.
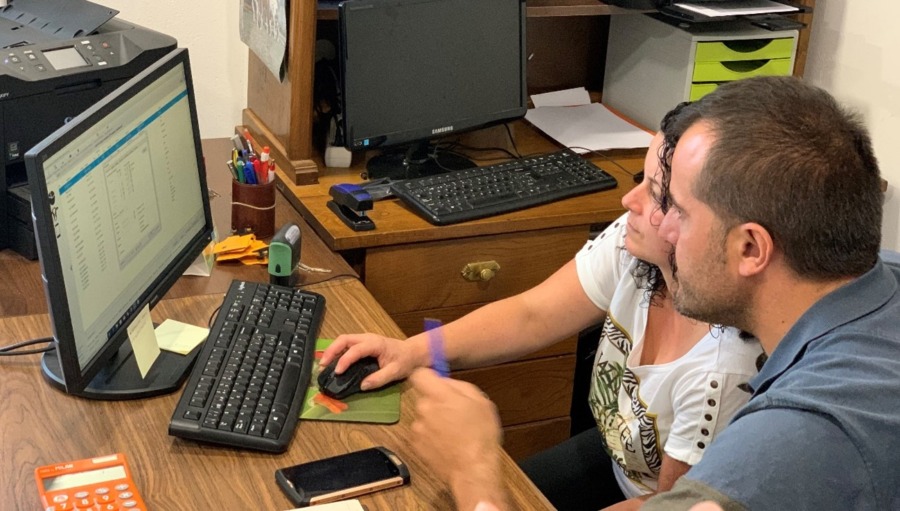
Image 1. The use of farm management software can be very useful for organizing daily work and monitoring the herd.
All this technology has brought with it an increase of permanently available data for herd management. This is beneficial because milk production is a very dynamic production system that requires constant decision making. IT decision support tools have become crucial for dairy farm management (Cabrera, 2018).
Converting data into information
However, on many farms, despite the increase in available data, important management decisions are still made in an unplanned way and based on intuition or experience (Groenendaal and Galligan, 2005). It also happens that all the data provided by new technologies are underutilized, either because of lack of training of the people working on the farm, because a new tool is launched without being sufficiently validated or because there is no communication between the systems used on the farm (Barkema et al., 2015).
Many of the on-farm systems are specific to collect data generated by devices, and subsequently analyze the performance of these devices and machinery. However, they do not provide a global view of the herd situation, but only allow action and analysis in one area of the farm. It is often the case that there is no connection or communication between these systems on a farm, and several apps and screens need to be checked to analyze the data and come to a conclusion. The more technology is introduced on farms, the more necessary it becomes to have a management software that can integrate information from all systems in one place, thus achieving a framework of effective, more visual, and understandable decision support tools, accurately reflecting the events occurring on the farm (Giordano et al., 2011). What is the point of having all this data otherwise?
To be clear, data is not the same as information. When we talk about data, we refer to measurements or values that are collected with the goal of making an analysis or obtaining a reference. The capacity to collect data is increasing. Information, on the other hand, is the result of reviewing and transforming data so that it can be analyzed, and knowledge is created. Most commonly, we are consumers of information, meaning this data that has been previously processed by the tool (i.e. software) to display it in a more visual and understandable way for the user.
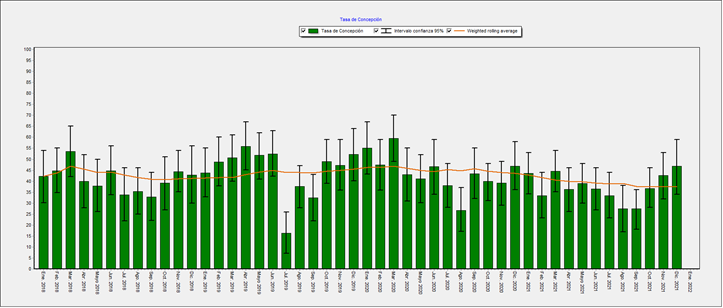
Figure 2: Fertility analysis over time (January 2018 to January 2022) in the UNIFORM software. This graph is an example of the transformation of data into information. You can clearly see the impact of heat stress during the summer months on cow conception. Much more visual than a list with pregnancy checks results.
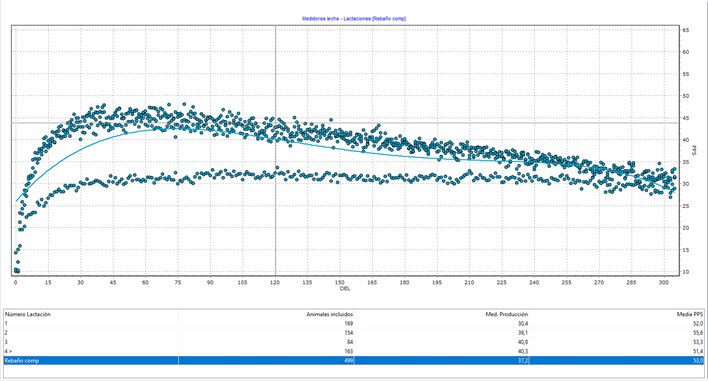
Figure 3: Another example of data transformation. Lactation curves of a whole herd in UNIFORM. The graph shows kg milk (ordinate axis) per days in milk (abscissa axis). The difference in production between animals in the first lactation (curve with the lowest peak) and the rest of the lactations can be noticed. The blue line shows the average lactation of the herd.
Herd performance monitoring
To be able to monitor what is happening on the farm, it is not enough to do one-off analyses, continuous monitoring is required in different areas of management. This is what is known as herd monitoring: the regular recording and analysis of events on the farm in order to assess the degree of change, intentional or unintentional, positive or negative. Hence the importance of decision support tools such as management software. And the importance that all those involved in the decision-making process (farmers and advisors) know how to use them correctly (from data collection to review of analyses).
Monitoring allows us to define the “normal” performance of any livestock farm and, also, to detect unforeseen changes, motivate changes in management and measure the effect of these changes.
Monitoring is carried out through the evaluation of several indicators, selected according to what has to be monitored, and always towards the achievement of previously established goals. These must be realistic for each farm, and achievable within a set period of time. It is rarely a good idea to use the target itself as a monitoring indicator (Overton, 2011).
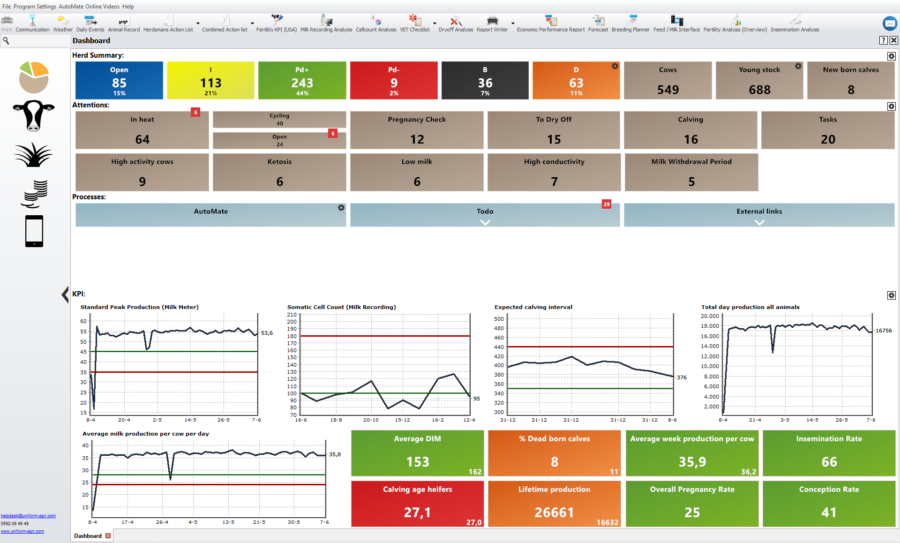
A very clear example is the calving interval. It may be a goal to reduce the interval, but this indicator is the result of many other processes involved in achieving the target and, moreover, the effects of changes affecting this indicator will be reflected several months later (due to the length of pregnancies). Therefore, the indicators to be used in this case should be: days open, insemination rate, conception rate at first insemination, etc.
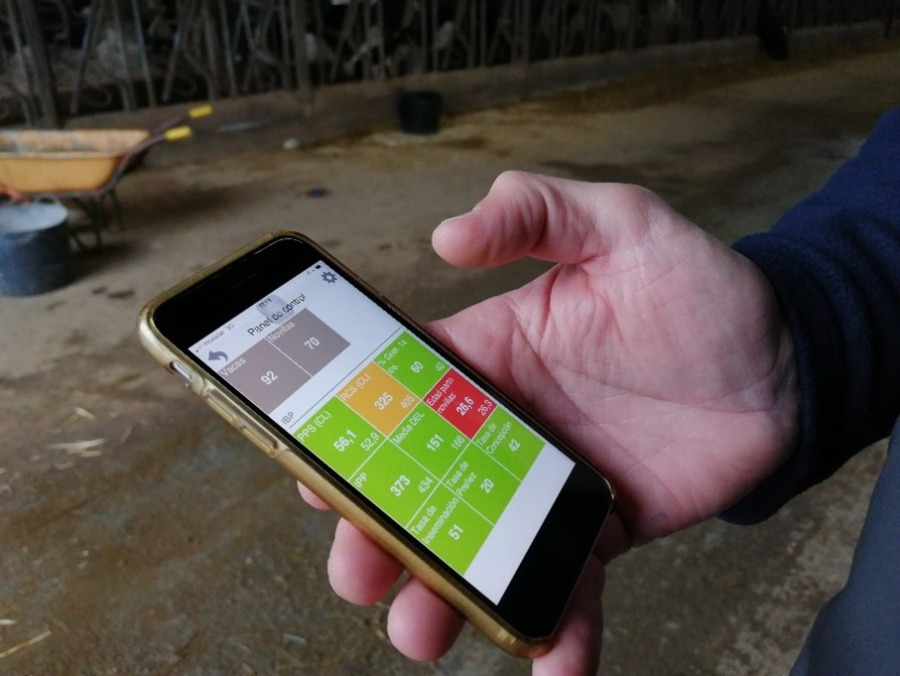
Image 2: Monitoring the herd from UNIFORM mobile App. Checking the most relevant indicators on the App dashboard.
Effect of constant monitoring
In order to give a small example of what using a farm management software can bring, the results of a group of 55 farms in Spain that have worked with the software of the company UNIFORM-Agri BV are shown below.
These 55 farms have sent information twice a month, every month, completely anonymously during the years 2019, 2020 and 2021. It is a heterogeneous group, with different realities and farm systems.

Table 1: evaluation over time (2019 to 2021) of 55 farms using the UNIFORM management software in Spain. Data submission has been completely anonymous. The annual average for each indicator is shown, as well as the difference between 2019 and 2021 in order to assess performance over time.
As these are average values, the dispersion of the data is not visible. For some indicators, the results in 2020 are better than the following year (many in the area of reproduction) although in 2021 there is still an improvement compared to 2019. For other indicators (udder health or finished lactation production) there is improvement between 2020 and 2021.
The trend of increasing herd size can be noticed. Regarding milk production, an increase can be noticed between 2019 and 2021 in kg produced and also in lactation length. In reproduction, some improvement can also be noticed, especially in the insemination rate and thus in the pregnancy rate. In udder health, it seems that the trend of the average SCC is decreasing. Finally, in sustainability, lifetime efficiency (lifetime production divided by days lived), has increased by half a point since birth, so that the performance of rearing management can also be evaluated with this indicator.
From the interpretation of these indicators, one cannot deduce causality, one cannot conclude that, unequivocally, having a management software will improve herd performance. It depends not only on having a software, but also on the use of the software and many other factors. However, the group of herds used in this sample has different realities and the result is that the group is gradually improving. Therefore, it is possible to conclude a certain correlation since a herd management software is a fundamental tool for making decisions on the farm in a more contrasted way and that allows a correct monitoring of the strategies and changes that are implemented or occur.
IT tools to support the farmer-consultant relationship
It is in the process of herd monitoring that the veterinarian who usually visits the farm and other consultants play a key role in advising the farmer in his decision making. However, just as in the introduction of new technologies there can be consequences that lead to under-utilisation of tools (due to miscommunication between systems or lack of training of staff), so too with regard to the relationship and communication between farmer and consultant there can be obstacles that affect decision-making and the monitoring of changes made in herd management.
In a recent study on veterinarians’ motivations and barriers to on-farm advising, veterinarians pointed out as barriers that producers did not perceive their problems and the lack of reliable data or facilities. About the veterinarian-producer relationship, the importance of building trust and developing strong relationships was highlighted as key factors for veterinarians to proactively engage and “go the extra mile” for their clients (Brocket et al., 2021). The use of IT tools for decision making is a great support for building a trusting relationship between farmer and advisors. It is therefore of great interest that the advisors are also training in the use of this tools and apps.
On the other hand, many farmers prefer to work with a proactive person who can give good technical advice. And who is also open to discussion with the farmer to make changes (Hall and Wapenaar, 2012). It is also important that both parties (farmer and advisors) share priorities in terms of farm management. In an earlier study (Kristensen and Enevoldsen, 2008), veterinarians seemed to focus too much on financial results and increased production compared to the expectations of most of the participating farmers, which turned out to be ‘teamwork’ and ‘animal welfare’. This suggests that finances are not always the main driver and that it is important to focus on more than cost when initiating change on the farm.
Conclusion
In summary, farmers look to their advisors for support in decision-making, with whom they can discuss priorities and changes. It is also important that everyone in the farmer’s environment has the same message. To achieve this, the decision support tools used must be practical for everyone.
With a flexible and visual software, agile in data collection by those working on the farm, able to integrate data from various sources, and which uses the data in a validated way and converts it into reliable information, it is easier to monitor the herd, control changes and also helps advisors to show the farmer in a practical way the effect of their proposals. This improves communication between all parties involved and allows decisions to be made based in evidence, not in feelings.
References
- Barkema et al., 2015. Invited review: Changes in the dairy industry affecting dairy cattle health and welfare. Dairy Sci. 98: 7426–7445.
- Brocket et al., 2021. Motivations and Barriers for Veterinarians when facilitating fertility management on UK dairy farms. Frontiers in Veterinary Science. DOI: 10.3389/fvets.2021.709336.
- Cabrera, 2018. Invited review: Helping dairy farmers to improve economic performance utilizing data-driving decision support tools. Animal 12:1, pág. 134–144.
- Gargiulo et al., Dairy farmers with larger herd sizes adopt more precision dairy technologies. J. Dairy Sci. 101:5466–5473.
- Giordano et al., An economic decision-making support system for selection of reproductive management programs on dairy farms. Journal of Dairy Science 94, 6216–6232.
- Groenendaal H y Galligan DT, 2005. Making informed culling decisions. Advances in Dairy Technology 17, 333–344.
- Hall y Wapenaar, 2012. Opinions and practices of veterinarians and dairy farmers towards herd health management in the UK. Veterinary Record (2012) 170, 441.
DOI: 10.1136/vr.100318 - Kristensen y Enevoldsen, 2008. A mixed methods inquiry: How dairy farmers perceive the value(s) of their involvement in an intensive dairy herd health management program. Acta Veterinaria Scandinavica 50, 50.
- Ministerio de Agricultura Pesca y Alimentación. Informe de Coyuntura del sector lácteo, enero 2022.
- Overton M W, 2011. En el capítulo 22 del libro Dairy Production Medicine. Editado por Risco C A y Melendez P. Publicado por John Wiley & Sons, Inc. Pág. 271 – 302.
- Rutten et al. Invited review: Sensors to support health management on dairy farms. J. Dairy Sci. 96:1928–1952.

UNIFORM-Agri
Almudena Molinero Argüello
Sales Manager Spain
almudena@uniform-agri.com

